Skip links

F&B Services Index

Food & Beverage Services Index (Dec 2024)

Sales of food & beverage (F&B) services increased 1.0% in December 2024 on a year-on-year basis, compared to the 4.0% growth in November 2024. On a seasonally adjusted basis, sales of F&B services fell 2.2% in December 2024 compared to the previous month.

The total sales value of F&B services in December 2024 was estimated at $1.0 billion. Of this, an estimated 24.8% were from online sales, similar to the 24.7% recorded in November 2024

Year-on-Year Change (At Current Prices)

Within the F&B services sector, Food Caterers registered the largest growth in sales of 16.7%. Similarly, turnover of Fast Food Outlets and Restaurants increased 1.4% and 0.2% respectively during this period. In contrast, turnover of Cafes, Food Courts & Other Eating Places fell 2.7% in December 2024

Month-on-Month Change (At Current Prices, Seasonally Adjusted)

On a seasonally adjusted month-on-month basis, sales of Cafes, Food Courts & Other Eating Places as well as Food Caterers decreased 3.7% and 3.3% respectively. Similarly, Restaurants fell 1.5% during this period. In contrast, turnover of Fast Food Outlets rose 0.8% in December 2024.

Food & Beverage Services Index (Jan 2022)

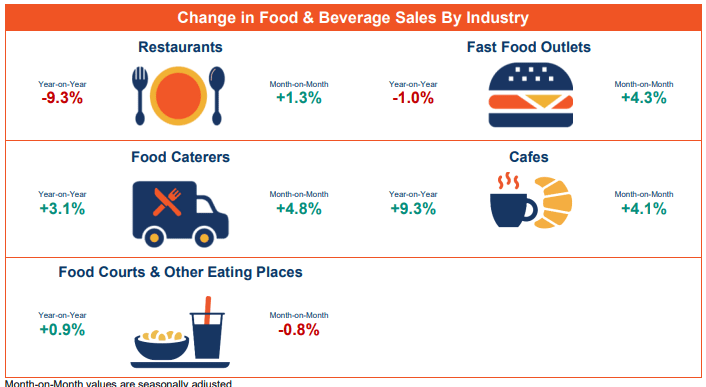
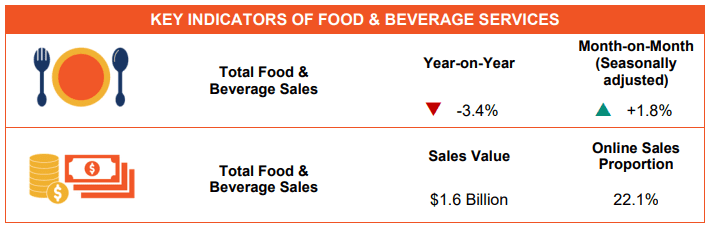
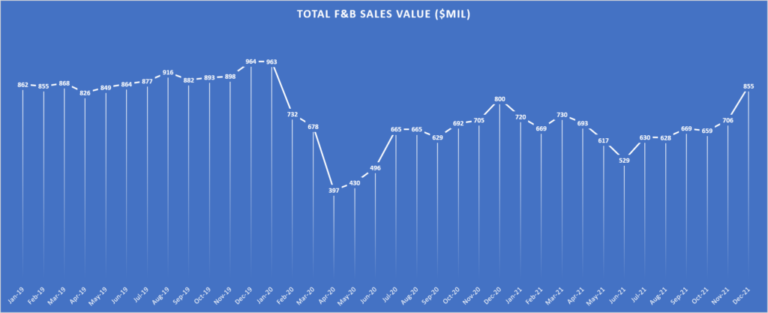
Sales of food & beverage services increased 9.5% in January 2022 on a year-on-year basis, compared to the 7.3% increase in December 2021. On a seasonally adjusted basis, sales of food & beverage services fell 3.5% in January 2022 over the previous month.

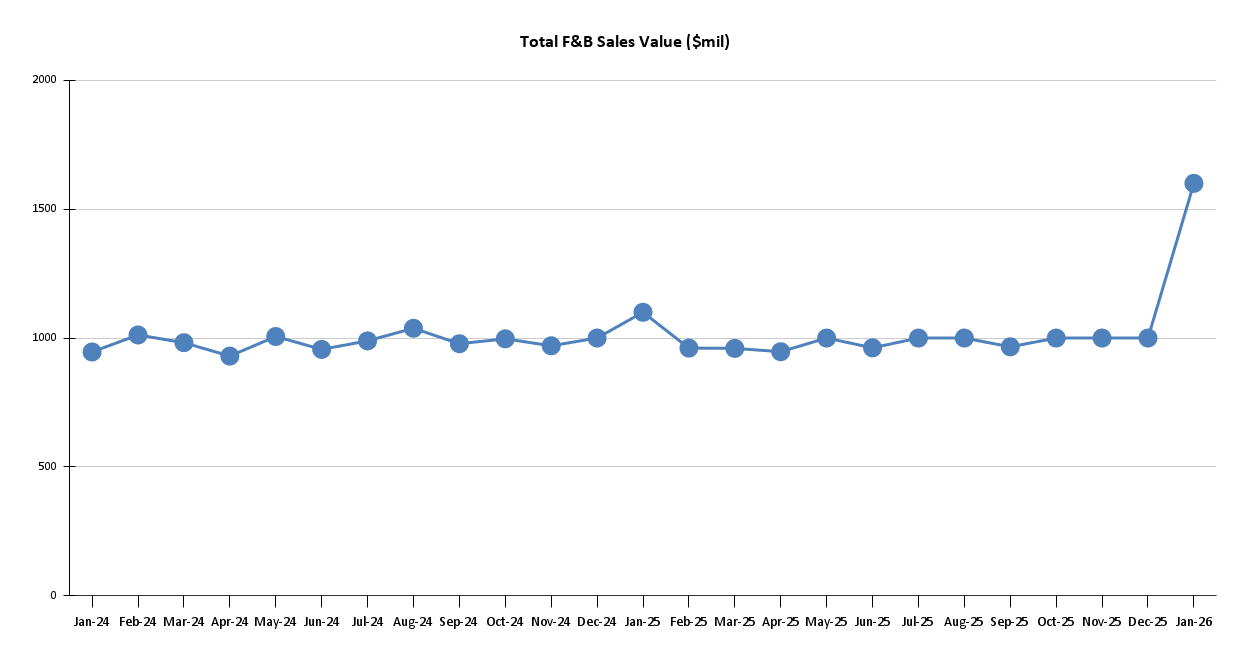
The total sales value of food & beverage services in January 2022 was estimated at $829 million.

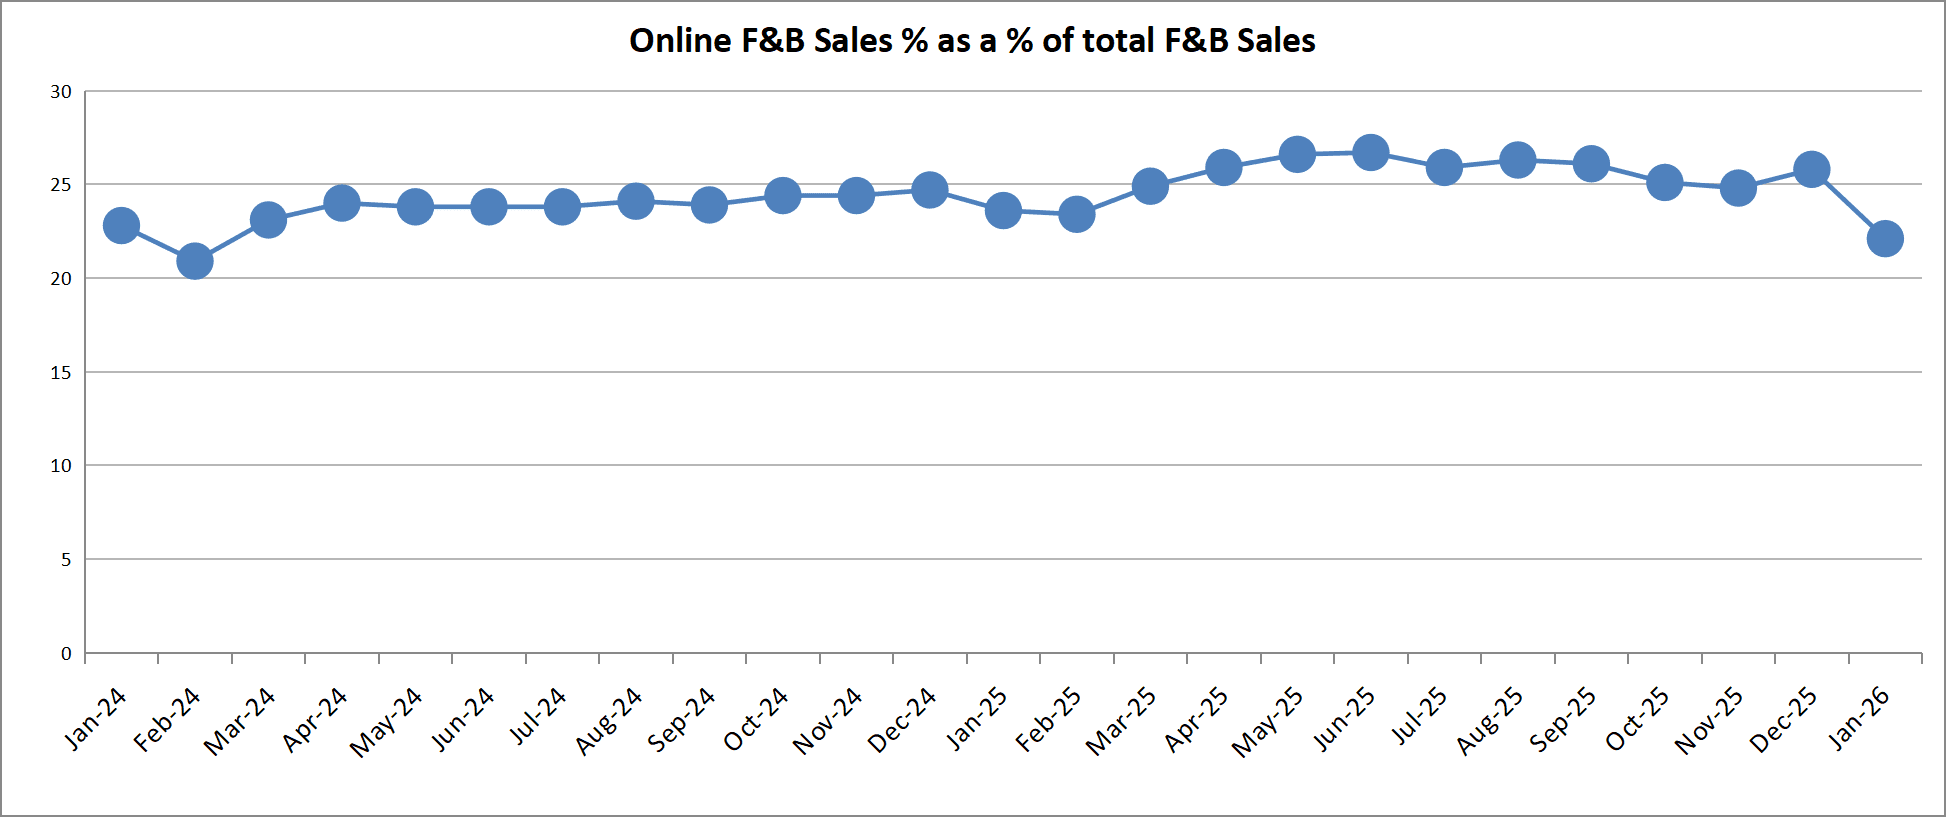
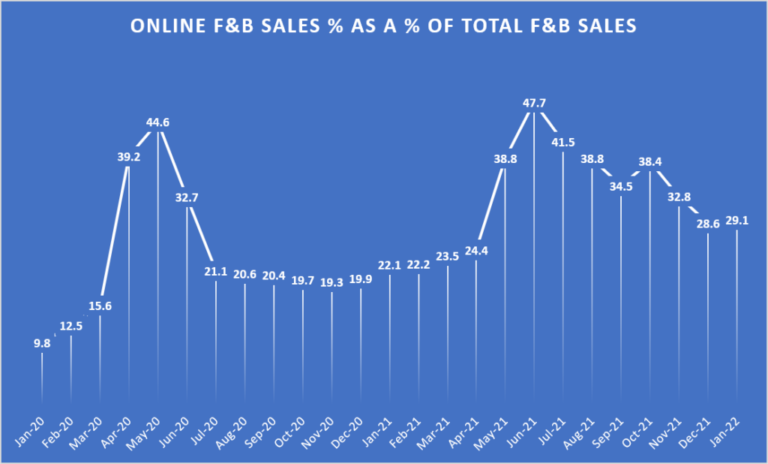
Of this, online food & beverage sales made up an estimated 29.1%, compared to the 28.6% recorded in December 2021.

Read the latest report (in full) here: Monthly F&B Services Index

This website uses cookies to improve your web experience.